> ## Documentation Index
> Fetch the complete documentation index at: https://docs.wrango.io/llms.txt
> Use this file to discover all available pages before exploring further.
# Campaign reporting
> Create and read Campaign reports in Workspace view
**Campaign reporting** shows how a **Campaign** performed across destinations. You build a custom table of dimensions and metrics for one **active campaign**.
**Admins** and **marketers** with workspace access can create and use Campaign reports. There are no extra role restrictions beyond workspace access.
## Reports dashboard
Open **Reports** from the left navigation in **Workspace view**. The page title is **Reports**.
| Tab | What it lists |
| --------------- | --------------------------------------------------- |
| **All Reports** | Campaign, Website, and Script Lift reports together |
| **Campaign** | Campaign reports only |
| **Website** | Website reports only |
| **Script Lift** | Script Lift reports only |
Use **Create report** to add a new report. **Search** and **Tags** filter the dashboard table. Click a row to open the report builder.
### Campaign tab columns
* **Campaign** (report name)
* **Associated Campaign** (linked campaign)
* **Tags**
* **Created** (date and author)
## What a Campaign report shows
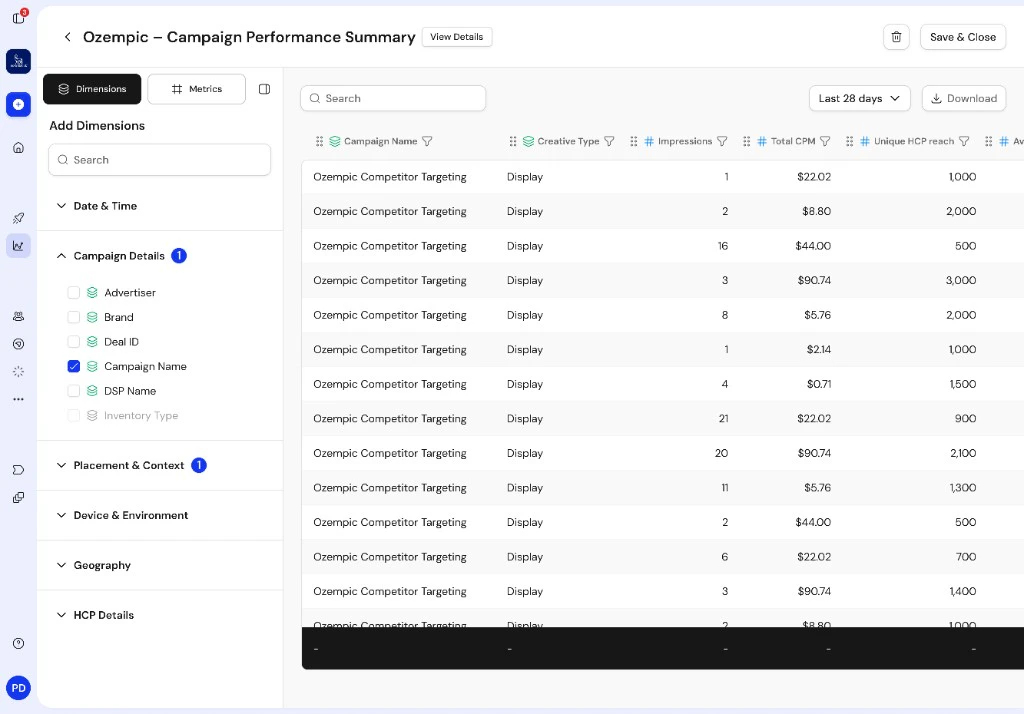
A Campaign report is a performance table for a single **active campaign**. You choose **dimensions** (breakdowns) and **metrics** (measures) from the campaign reporting catalog, set a date range, sort columns, and download CSV data.
The header title follows: `{report name} – Campaign Performance Summary`.
The builder has no separate chart or summary-tile views. The main surface is the data table and a totals row for selected metrics.
 ## Create a Campaign report
The only way to create a Campaign report is from **Reports**.
In **Workspace view**, go to **Reports** and click **Create report**.
On **What are you looking to report on?**, select **Campaign Report**, then click **Continue**.
On **Add your Campaign Report details**, set:
* **Report name**
* **Description** (optional)
* **Campaign** (required): choose an **active campaign**
* **Tags** (optional)
Click **Continue** to open the report builder.
Wrango does not pre-select dimensions or metrics. You choose columns in the builder, then **Save & Close** to persist your selection.
## Unlock paid Campaign fields (Script Lift)
**Paid** campaign dimensions and metrics require **Script Lift Reporting & Offline Conversion Events** on the **campaign** attached to the report.
Turn on **Script Lift Reporting & Offline Conversion Events** in the [Create Campaign Flow](/campaigns/create) **Reporting options** step before you publish. Published campaigns cannot be edited, and this upgrade cannot be enabled after the campaign is **Active**.
That upgrade adds prescribing-related **paid** fields to the campaign catalog, such as **Gross TRX**, **Gross NRX**, **New Patients**, and **New Prescribers**. It also makes the campaign eligible for a Script Lift report once it is **Active**.
For Script Lift report setup, see [Create a Script Lift report](/reports/script-lift/create). For paid fields on Website reports, see [Website reporting](/reports/website).
## Paid dimensions and metrics
Wrango loads **dimensions** and **metrics** for Campaign and Website reports from the reporting catalog API (`/reports/dimensions-and-metrics`). Each item includes a display **label**, grouping **category**, internal **key**, and a **`paid`** flag.
Fields marked **`paid`** show a **paid** tag in the dimensions and metrics panel.
### When paid fields are available
| Report type | Upgrade | Where you turn it on |
| ------------ | ----------------------------------------------------- | -------------------------------------------------------------------------------------------------------------------------------- |
| **Campaign** | **Script Lift Reporting & Offline Conversion Events** | [Create Campaign Flow](/campaigns/create), **Reporting options** step (before publish only) |
| **Website** | **PLD Resolution** | [Create a pixel](/pixels/create) **Optional Upgrade** step, or the pixel side panel on the [Pixels dashboard](/pixels/dashboard) |
**If the upgrade is off**
* **Website report** linked to a pixel with **PLD Resolution** off: **paid** fields are not available in the catalog.
* **Campaign report** linked to a campaign with **Script Lift Reporting & Offline Conversion Events** off: **paid** fields are not available in the catalog.
**If you select a paid field while the upgrade is off**
You can select the field in the panel and Wrango prompts you to turn on the matching upgrade:
* Turn on **PLD Resolution** for the pixel tied to the Website report from the [Pixels dashboard](/pixels/dashboard) or during [Create a pixel](/pixels/create).
* Turn on **Script Lift Reporting & Offline Conversion Events** in the [Create Campaign Flow](/campaigns/create) before the campaign is **Active**.
There are no other paid field sources. Every **paid** field is tied either to **PLD Resolution** on the pixel or to **Script Lift Reporting & Offline Conversion Events** on the campaign.
### Pixel and Campaign reporting
* **Website reporting** is based on an **active pixel** you select when you create the report.
* **Campaign reporting** is based on an **active campaign** you select when you create the report. It does not use a pixel ID to load performance rows.
**Website Reporting** on a campaign (builder **Reporting options** step) links a pixel for campaign attribution when the campaign is published. That is separate from creating a **Website Report** under **Reports**.
## Dimensions and metrics catalog
The platform groups fields by **category** in the left panel. Each field shows a **paid** tag when `paid` is true in the catalog.
### Dimensions
| Category | Label | Key |
| -------------------- | ------------------ | -------------------- |
| Date & Time | Date | `date` |
| Date & Time | Day of Week | `dayOfWeek` |
| Date & Time | Activity Date Time | `activity_date_time` |
| Campaign Details | Campaign Name | `campaignName` |
| Campaign Details | Advertiser | `advertiser` |
| Campaign Details | Brand | `brand` |
| Campaign Details | Deal ID | `dealId` |
| Campaign Details | DSP Name | `dspName` |
| Campaign Details | Inventory Type | `inventoryType` |
| Placement & Context | Creative Type | `creativeType` |
| Placement & Context | Placement Size | `placementSize` |
| Device & Environment | Device Type | `deviceType` |
| Device & Environment | Browser | `browser` |
| Geography | Region | `region` |
| Geography | State | `state` |
| HCP Details | Specialty | `specialty` |
| HCP Details | NPI Status | `npiStatus` |
### Metrics
| Category | Label | Key |
| ---------- | ---------------- | ---------------- |
| Delivery | Impressions | `impressions` |
| Delivery | Clicks | `clicks` |
| Delivery | Completions | `completions` |
| Cost | Total CPM | `totalCpm` |
| Cost | Total Spend | `totalSpend` |
| Engagement | CTR | `ctr` |
| Engagement | VCR | `vcr` |
| Reach | Unique HCP Reach | `uniqueHcpReach` |
| Reach | Frequency Cap | `frequencyCap` |
### Paid metrics (Script Lift)
When **Script Lift Reporting & Offline Conversion Events** is on for the report's campaign:
| Label (examples) |
| ---------------- |
| Gross TRX |
| Gross NRX |
| New Patients |
| New Prescribers |
Exact keys and categories come from the catalog response for your workspace.
## Report builder layout
### Header
* Back control
* Title with **Campaign Performance Summary**
* **View Details**
* **Reset**
* **Save & Close**
### Dimensions and metrics panel
* **Dimensions** and **Metrics** tabs
* **Search** filters field labels in this panel (operational today)
* Accordion groups by catalog **category**
* Count badge on each group for selected fields in that group
* **Paid** tag on gated fields
* Resizable panel (drag the right edge)
If nothing is selected, the table shows: **Select dimensions or metrics to build your report**.
### Table area
* **Date range** (default: last 28 days through today)
* **Quick Selections**: **Last 28 days**, **Last 90 days**, and **Last 365 days**
* When **Activity Date Time** is selected as a dimension, the filter also includes **Time (UTC)** for more precise start and end values
* **Download** (CSV)
* Data table with sortable, reorderable columns
* Column filter on **Date** and **Day of Week** (calendar range); other columns show **Filter coming soon**
* Infinite scroll
* Totals row for selected metrics when metrics are selected
## Export
**Download** opens **Download full report**, which exports every row for the selected columns and date range as a CSV. The dialog shows **Rows to download**, an **Estimated time**, progress while the export runs, and **Cancel**. Filename uses the report name when set.
## Create a Campaign report
The only way to create a Campaign report is from **Reports**.
In **Workspace view**, go to **Reports** and click **Create report**.
On **What are you looking to report on?**, select **Campaign Report**, then click **Continue**.
On **Add your Campaign Report details**, set:
* **Report name**
* **Description** (optional)
* **Campaign** (required): choose an **active campaign**
* **Tags** (optional)
Click **Continue** to open the report builder.
Wrango does not pre-select dimensions or metrics. You choose columns in the builder, then **Save & Close** to persist your selection.
## Unlock paid Campaign fields (Script Lift)
**Paid** campaign dimensions and metrics require **Script Lift Reporting & Offline Conversion Events** on the **campaign** attached to the report.
Turn on **Script Lift Reporting & Offline Conversion Events** in the [Create Campaign Flow](/campaigns/create) **Reporting options** step before you publish. Published campaigns cannot be edited, and this upgrade cannot be enabled after the campaign is **Active**.
That upgrade adds prescribing-related **paid** fields to the campaign catalog, such as **Gross TRX**, **Gross NRX**, **New Patients**, and **New Prescribers**. It also makes the campaign eligible for a Script Lift report once it is **Active**.
For Script Lift report setup, see [Create a Script Lift report](/reports/script-lift/create). For paid fields on Website reports, see [Website reporting](/reports/website).
## Paid dimensions and metrics
Wrango loads **dimensions** and **metrics** for Campaign and Website reports from the reporting catalog API (`/reports/dimensions-and-metrics`). Each item includes a display **label**, grouping **category**, internal **key**, and a **`paid`** flag.
Fields marked **`paid`** show a **paid** tag in the dimensions and metrics panel.
### When paid fields are available
| Report type | Upgrade | Where you turn it on |
| ------------ | ----------------------------------------------------- | -------------------------------------------------------------------------------------------------------------------------------- |
| **Campaign** | **Script Lift Reporting & Offline Conversion Events** | [Create Campaign Flow](/campaigns/create), **Reporting options** step (before publish only) |
| **Website** | **PLD Resolution** | [Create a pixel](/pixels/create) **Optional Upgrade** step, or the pixel side panel on the [Pixels dashboard](/pixels/dashboard) |
**If the upgrade is off**
* **Website report** linked to a pixel with **PLD Resolution** off: **paid** fields are not available in the catalog.
* **Campaign report** linked to a campaign with **Script Lift Reporting & Offline Conversion Events** off: **paid** fields are not available in the catalog.
**If you select a paid field while the upgrade is off**
You can select the field in the panel and Wrango prompts you to turn on the matching upgrade:
* Turn on **PLD Resolution** for the pixel tied to the Website report from the [Pixels dashboard](/pixels/dashboard) or during [Create a pixel](/pixels/create).
* Turn on **Script Lift Reporting & Offline Conversion Events** in the [Create Campaign Flow](/campaigns/create) before the campaign is **Active**.
There are no other paid field sources. Every **paid** field is tied either to **PLD Resolution** on the pixel or to **Script Lift Reporting & Offline Conversion Events** on the campaign.
### Pixel and Campaign reporting
* **Website reporting** is based on an **active pixel** you select when you create the report.
* **Campaign reporting** is based on an **active campaign** you select when you create the report. It does not use a pixel ID to load performance rows.
**Website Reporting** on a campaign (builder **Reporting options** step) links a pixel for campaign attribution when the campaign is published. That is separate from creating a **Website Report** under **Reports**.
## Dimensions and metrics catalog
The platform groups fields by **category** in the left panel. Each field shows a **paid** tag when `paid` is true in the catalog.
### Dimensions
| Category | Label | Key |
| -------------------- | ------------------ | -------------------- |
| Date & Time | Date | `date` |
| Date & Time | Day of Week | `dayOfWeek` |
| Date & Time | Activity Date Time | `activity_date_time` |
| Campaign Details | Campaign Name | `campaignName` |
| Campaign Details | Advertiser | `advertiser` |
| Campaign Details | Brand | `brand` |
| Campaign Details | Deal ID | `dealId` |
| Campaign Details | DSP Name | `dspName` |
| Campaign Details | Inventory Type | `inventoryType` |
| Placement & Context | Creative Type | `creativeType` |
| Placement & Context | Placement Size | `placementSize` |
| Device & Environment | Device Type | `deviceType` |
| Device & Environment | Browser | `browser` |
| Geography | Region | `region` |
| Geography | State | `state` |
| HCP Details | Specialty | `specialty` |
| HCP Details | NPI Status | `npiStatus` |
### Metrics
| Category | Label | Key |
| ---------- | ---------------- | ---------------- |
| Delivery | Impressions | `impressions` |
| Delivery | Clicks | `clicks` |
| Delivery | Completions | `completions` |
| Cost | Total CPM | `totalCpm` |
| Cost | Total Spend | `totalSpend` |
| Engagement | CTR | `ctr` |
| Engagement | VCR | `vcr` |
| Reach | Unique HCP Reach | `uniqueHcpReach` |
| Reach | Frequency Cap | `frequencyCap` |
### Paid metrics (Script Lift)
When **Script Lift Reporting & Offline Conversion Events** is on for the report's campaign:
| Label (examples) |
| ---------------- |
| Gross TRX |
| Gross NRX |
| New Patients |
| New Prescribers |
Exact keys and categories come from the catalog response for your workspace.
## Report builder layout
### Header
* Back control
* Title with **Campaign Performance Summary**
* **View Details**
* **Reset**
* **Save & Close**
### Dimensions and metrics panel
* **Dimensions** and **Metrics** tabs
* **Search** filters field labels in this panel (operational today)
* Accordion groups by catalog **category**
* Count badge on each group for selected fields in that group
* **Paid** tag on gated fields
* Resizable panel (drag the right edge)
If nothing is selected, the table shows: **Select dimensions or metrics to build your report**.
### Table area
* **Date range** (default: last 28 days through today)
* **Quick Selections**: **Last 28 days**, **Last 90 days**, and **Last 365 days**
* When **Activity Date Time** is selected as a dimension, the filter also includes **Time (UTC)** for more precise start and end values
* **Download** (CSV)
* Data table with sortable, reorderable columns
* Column filter on **Date** and **Day of Week** (calendar range); other columns show **Filter coming soon**
* Infinite scroll
* Totals row for selected metrics when metrics are selected
## Export
**Download** opens **Download full report**, which exports every row for the selected columns and date range as a CSV. The dialog shows **Rows to download**, an **Estimated time**, progress while the export runs, and **Cancel**. Filename uses the report name when set.